Microsoft Excel Tutorials, Formulas, Functions, Templates & Tips
Microsoft Excel is one of the most useful spreadsheet applications for managing information, performing calculations, analyzing data, creating reports, building dashboards and automating repetitive tasks. From a simple personal expense sheet to a complex business reporting system, Excel can be adapted to many different requirements.
Welcome to the complete Microsoft Excel resource guide from ZeexasTech. This Excel pillar page is designed to help beginners, students, professionals, business owners, accountants, marketers, data analysts and anyone who wants to become more productive with spreadsheets.
You can use this guide to understand Excel fundamentals and then move gradually toward advanced topics such as formulas, XLOOKUP, PivotTables, dashboards, Power Query, Power Pivot, VBA, macros, AI and automation.
What Is Microsoft Excel?
Microsoft Excel is a spreadsheet application developed by Microsoft. It allows users to enter information into rows and columns, perform calculations, organize datasets, analyze information and create visual reports.
An Excel workbook can contain multiple worksheets. Each worksheet contains cells arranged into rows and columns. Cells can contain text, numbers, dates, formulas and other types of information.
For example, a simple sales spreadsheet might contain columns for:
- Date
- Customer
- Product
- Quantity
- Price
- Revenue
- Salesperson
- Location
Once the information is organized correctly, Excel can be used to calculate totals, compare performance, identify trends and create reports.
Excel is useful because it combines several capabilities in one application. You can use it as a basic calculator, a data-entry tool, a reporting system, a charting tool and an advanced data-analysis platform.
Microsoft’s Excel documentation covers a broad range of functionality, including worksheet functions, data analysis, PivotTables and Power Query.
Why Is Excel So Popular?
Excel has remained popular because it is flexible and can be used by people with very different levels of technical knowledge.
A beginner can create a simple monthly budget without knowing advanced formulas. At the same time, an experienced analyst can use Power Query, PivotTables, Data Models, DAX and automation to process large datasets.
Some common reasons people use Excel include:
- Easy spreadsheet organization
- Powerful calculation capabilities
- Large collection of formulas and functions
- Charts and visualization
- PivotTables
- Data filtering and sorting
- Templates
- Data validation
- Conditional formatting
- Power Query
- Power Pivot
- VBA and macros
- Integration with other Microsoft tools
- AI-assisted productivity features
Excel can also be used without building a complicated software application. A business can start with a simple workbook and gradually improve it as its requirements become more advanced.
Excel for Beginners
If you have never used Excel before, you should first understand the basic structure of a workbook.
When you open Excel, you normally work inside a workbook. A workbook can contain multiple worksheets, while each worksheet contains rows and columns.
For example:
A1 means column A and row 1.
B5 means column B and row 5.
A1:A10 means the range from A1 through A10.
A1:C10 represents a larger rectangular range.
Understanding cell references is important because formulas use these references to perform calculations.
What Should Excel Beginners Learn First?
A beginner should start with:
- Creating a workbook
- Creating worksheets
- Entering data
- Formatting cells
- Adjusting row and column sizes
- Saving and opening files
- Copying and pasting information
- Sorting data
- Filtering data
- Creating simple formulas
- Using basic functions
- Creating simple charts
After learning these fundamentals, you can move to more advanced topics.
Recommended resource: Excel Basics and Beginner Tutorials
Understanding Excel Rows, Columns and Cells
Rows run horizontally across a worksheet and are identified by numbers.
Columns run vertically and are identified by letters.
The intersection of a row and a column is called a cell.
For example:
- A1 is a cell
- C5 is a cell
- D10 is a cell
You can enter different types of information into cells, including:
- Text
- Numbers
- Dates
- Times
- Formulas
- Percentages
- Currency values
For business spreadsheets, it is important to keep data structured properly.
For example, instead of putting an entire customer record into one cell, use separate columns for:
Customer Name | Phone | Email | City | Product | Amount
This structure makes sorting, filtering and analysis much easier.
Excel Formatting
Formatting changes how information appears without necessarily changing the underlying value.
You can format cells as:
- General
- Number
- Currency
- Percentage
- Date
- Time
- Text
You can also change:
- Font
- Font size
- Bold
- Italic
- Alignment
- Borders
- Number format
- Row height
- Column width
Good formatting is particularly important for business reports because it improves readability.
However, formatting should not be excessive. A professional spreadsheet should make important information easier to understand rather than making the worksheet visually complicated.
Excel Formulas and Functions
Formulas are at the heart of Excel.
A formula tells Excel how to calculate something.
For example:
=A1+B1
adds the values stored in A1 and B1.
Another example is:
=SUM(A1:A10)
which adds the values in the specified range.
Functions are predefined formulas designed to perform particular calculations.
Some of the most useful Excel functions include:
- SUM
- AVERAGE
- COUNT
- COUNTA
- COUNTIF
- COUNTIFS
- SUMIF
- SUMIFS
- IF
- IFS
- AND
- OR
- XLOOKUP
- VLOOKUP
- INDEX
- MATCH
- FILTER
- UNIQUE
- SORT
- LEFT
- RIGHT
- MID
- TEXT
- TODAY
- NOW
- DATE
Microsoft maintains a categorized Excel function reference that includes lookup, logical, mathematical, statistical, text, date and other function groups.
Excel SUM Function
The SUM function is one of the first functions most Excel users learn.
For example:
=SUM(A1:A10)
adds all numbers from A1 to A10.
SUM is useful for:
- Sales totals
- Monthly expenses
- Salary totals
- Inventory values
- Invoice totals
- Budget calculations
- Revenue reports
You can also add multiple ranges.
For example:
=SUM(A1:A10,C1:C10)
This allows you to combine multiple ranges within one formula.
Excel IF Function
The IF function allows Excel to make a logical decision.
A simple example is:
=IF(A1>=50,”Pass”,”Fail”)
If A1 contains 50 or more, Excel returns “Pass”. Otherwise, it returns “Fail”.
IF is useful for:
- Pass/fail calculations
- Sales targets
- Employee performance
- Payment status
- Inventory warnings
- Eligibility checks
- Business rules
Once you understand IF, you can combine it with other functions to build more advanced calculations.
Excel SUMIF and SUMIFS
SUMIF calculates a total based on a condition.
For example, you could calculate sales for only the “North” region.
SUMIFS is useful when multiple conditions need to be applied.
For example, you might calculate:
- Sales for a particular employee
- Sales for one product
- Sales for one city during a specific month
- Expenses for a particular department
SUMIFS becomes particularly powerful when working with structured business datasets.
Excel COUNTIF and COUNTIFS
COUNTIF counts cells that meet a specific condition.
For example, you could count the number of customers from Delhi.
COUNTIFS allows multiple conditions.
You could use it to count:
- Customers from Delhi who purchased Product A
- Employees in the Sales department with a specific status
- Orders above a certain amount
- Transactions within a particular date range
These functions are useful for dashboards and business reports.
XLOOKUP in Excel
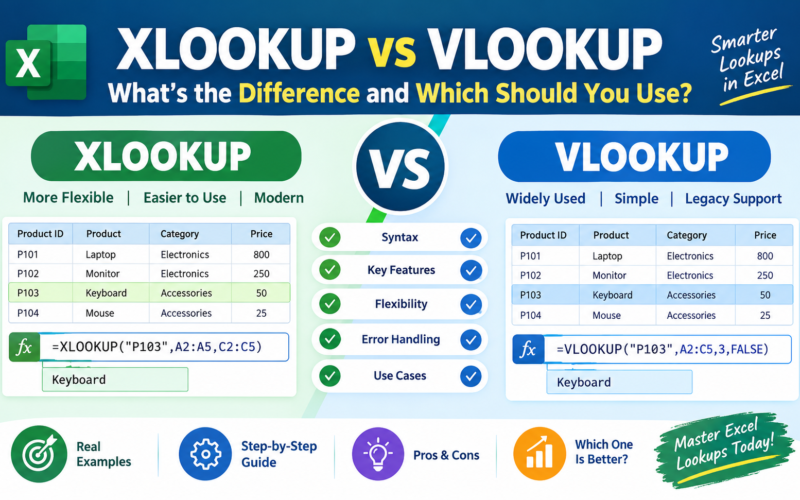
XLOOKUP is a modern lookup function that can search for a value and return a corresponding result.
A basic example is:
=XLOOKUP(A2,E2:E100,F2:F100,”Not Found”)
Here Excel searches for the value in A2 and returns the corresponding value from another range.
XLOOKUP can be useful for:
- Employee information
- Product prices
- Customer details
- Inventory lookup
- Sales reports
- Financial data
- CRM spreadsheets
Microsoft documents XLOOKUP as a lookup function that can search a range or array and return a corresponding result. Availability depends on the Excel version.
Recommended resource: Excel Formulas and Functions
VLOOKUP in Excel
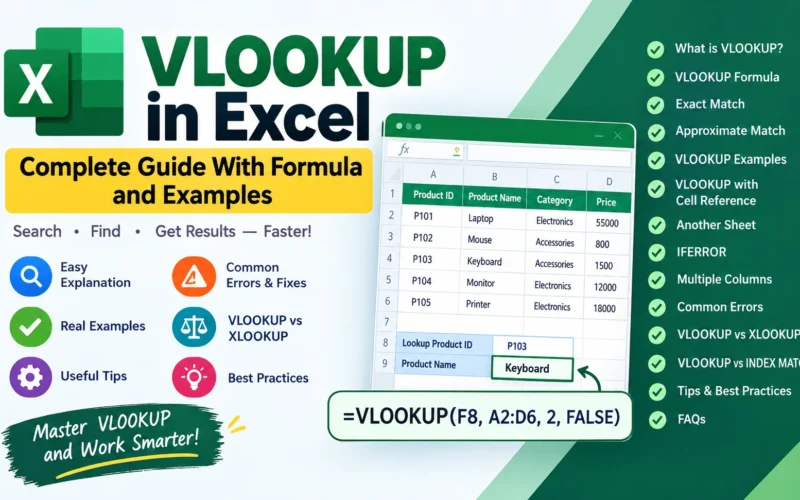
VLOOKUP is an older but still widely used Excel lookup function.
It is commonly found in existing business spreadsheets and older Excel tutorials.
VLOOKUP can search for a value in the first column of a table and return information from another column.
Although XLOOKUP is more flexible in supported versions, learning VLOOKUP remains useful because many companies still have older spreadsheets based on it.
For anyone working with existing Excel files, understanding both functions is valuable.
INDEX MATCH in Excel
INDEX and MATCH can be combined to create flexible lookup formulas.
MATCH identifies the position of a value, while INDEX returns a value from a specified position.
This combination became popular before XLOOKUP was widely available.
INDEX MATCH remains relevant when working with older Excel versions or legacy workbooks.
Understanding it also helps you understand how lookup logic works rather than simply memorizing one formula.
FILTER, UNIQUE and SORT Functions
Modern Excel includes dynamic-array functions that make it easier to work with datasets.
FILTER can return records matching specified criteria.
UNIQUE can return unique values from a dataset.
SORT can sort an array or range according to specified criteria.
For example, these functions can help create:
- Dynamic customer lists
- Unique product lists
- Filtered sales reports
- Dynamic dashboards
- Automated reporting tables
These functions are especially useful for users working with newer Excel versions.
Excel Tables
Excel Tables provide a structured way to organize data.
Instead of treating a dataset as an ordinary cell range, you can convert it into a table.
Tables can provide:
- Automatic filtering
- Structured references
- Automatic expansion
- Consistent formatting
- Easier formula management
- Better data organization
A sales table might include:
Date | Customer | Product | Quantity | Revenue | Salesperson
Once the data is structured as a table, it becomes easier to use formulas, PivotTables and other Excel tools.
Excel Sorting and Filtering
Sorting and filtering are fundamental spreadsheet skills.
You can sort data by:
- Alphabetical order
- Number
- Date
- Highest value
- Lowest value
Filtering lets you temporarily display only records that meet selected criteria.
For example, a company with 10,000 sales records could filter the dataset to show:
- Sales from January
- Sales from Delhi
- Sales from one salesperson
- Sales above ₹10,000
- A particular product
This can make large datasets much easier to analyze.
Excel Data Validation
Data validation allows you to control what users can enter into cells.
One of the most common applications is creating a drop-down list.
For example:
Status
- Pending
- Completed
- Cancelled
A drop-down list reduces inconsistent entries.
Data validation can be useful for:
- Employee forms
- CRM spreadsheets
- Inventory systems
- Sales trackers
- Project management
- Attendance systems
It is particularly useful when several people edit the same workbook.
Excel Conditional Formatting
Conditional formatting changes the appearance of cells based on rules.
For example, you can automatically highlight:
- Sales above target
- Negative values
- Overdue payments
- Low inventory
- Duplicate records
- High expenses
- Top-performing products
This allows important information to stand out without manually formatting each cell.
Conditional formatting can also be combined with dashboards to create more visual reports.
Excel Charts
Charts convert spreadsheet information into visual representations.
Common chart types include:
- Column charts
- Bar charts
- Line charts
- Pie charts
- Area charts
- Scatter charts
- Combo charts
A sales manager may use a column chart to compare sales between employees.
A business owner may use a line chart to see revenue trends across several months.
A financial analyst may use a combination of charts to compare revenue, expenses and profit.
The most important principle is to choose the chart based on the information you want the reader to understand.
Excel Dashboards
An Excel dashboard brings important metrics together in one visual report.
A business dashboard could contain:
- Total revenue
- Total profit
- Orders
- Customers
- Average order value
- Monthly sales
- Top products
- Regional performance
- Salesperson performance
- Expense information
Dashboards can use:
- PivotTables
- PivotCharts
- Slicers
- Tables
- Formulas
- Conditional formatting
- Charts
- KPI cards
A good dashboard should answer important business questions quickly.
For example:
How much did we sell this month?
Which product generated the most revenue?
Which region performed best?
Are sales increasing or decreasing?
Which salesperson achieved the target?
Recommended resource: Excel Charts and Dashboard Tutorials
Excel PivotTables
PivotTables are one of the most powerful features for summarizing structured data.
Imagine a company has 100,000 sales records.
Manually calculating sales by product, month and region would be time-consuming.
A PivotTable can summarize this information quickly.
You can create reports such as:
Sales by Region
Sales by Product
Sales by Month
Sales by Employee
Sales by Customer
Microsoft’s Excel documentation describes PivotTables as a tool for analyzing and reporting data, while PivotCharts and slicers can be used to make reports more interactive.
PivotTable Skills to Learn
A good PivotTable learning path includes:
- Creating a PivotTable
- Adding fields
- Creating row and column groups
- Adding values
- Changing calculations
- Sorting results
- Filtering data
- Grouping dates
- Adding slicers
- Creating PivotCharts
- Refreshing data
Recommended resource: Excel PivotTable Tutorials
Excel Power Query
Power Query is an advanced Excel feature for importing and transforming data.
It is especially useful when you receive data repeatedly and need to perform the same cleaning process every time.
For example, suppose you receive a monthly sales CSV.
Every month you need to:
- Remove unnecessary columns
- Rename columns
- Remove duplicate rows
- Change date formats
- Change number formats
- Combine files
- Create calculated columns
Instead of performing all these steps manually every month, Power Query can record a repeatable transformation process.
Microsoft describes Power Query as a technology for connecting to and transforming data in Excel.
Power Query Data Cleaning
Data cleaning is one of the most practical uses of Power Query.
Real-world datasets often contain:
- Duplicate records
- Blank values
- Incorrect data types
- Extra spaces
- Inconsistent names
- Unnecessary columns
- Different date formats
- Incorrect capitalization
Power Query can help standardize this information.
For example:
Delhi
delhi
DELHI
could be standardized into one consistent value.
This makes subsequent analysis much more reliable.
Power Query Merge and Append
Two important Power Query operations are Merge and Append.
Merge
Merge can be used to combine information from related datasets.
For example:
Customer Table + Customer Orders
could be connected using Customer ID.
Append
Append combines datasets with similar structures.
For example:
January Sales + February Sales + March Sales
can be combined into one dataset.
These operations are especially useful when working with recurring reports.
Excel Power Pivot and Data Models
Power Pivot and Data Models provide more advanced ways to work with multiple related tables.
For example, a business could have separate tables for:
Customers
Products
- Product ID
- Product Name
- Category
Sales
- Date
- Customer ID
- Product ID
- Quantity
- Revenue
Instead of combining everything into one huge table, relationships can connect these datasets.
Microsoft describes the Excel Data Model as a way to integrate multiple tables into a relational data source within a workbook.
This approach becomes particularly useful when analyzing larger or more complicated datasets.
DAX in Excel
DAX stands for Data Analysis Expressions.
It is used for calculations in Power Pivot and Data Models.
DAX can be used to create:
- Measures
- Calculated columns
- KPIs
- Business calculations
- Aggregations
- Time-based calculations
DAX is an advanced subject, so beginners should first learn Excel formulas, tables and PivotTables.
Once those concepts are understood, learning DAX becomes easier.
Excel VBA and Macros
VBA stands for Visual Basic for Applications.
Excel VBA can be used to automate repetitive tasks.
For example, a company may receive a raw report every morning.
A macro could potentially:
- Open the report
- Format the data
- Remove unnecessary information
- Apply calculations
- Create a summary
- Prepare a report
Macros can save time when repetitive spreadsheet operations are performed frequently.
VBA Learning Path
Beginners can start with:
- Recording macros
- Opening the VBA editor
- Understanding objects
- Working with worksheets
- Working with ranges
- Variables
- Conditions
- Loops
- Functions
- Error handling
- Automated reports
Recommended resource: Excel VBA and Macro Tutorials
Excel Templates
Excel templates can help users start projects quickly.
Common templates include:
- Invoice templates
- Expense trackers
- Budget sheets
- Attendance sheets
- Salary calculators
- Inventory trackers
- Sales trackers
- Project trackers
- Loan calculators
- Profit and loss reports
- Employee databases
- Business dashboards
A useful Excel template should not simply provide a blank spreadsheet.
A good template should explain:
- What it is designed for
- Who should use it
- How to enter information
- What each worksheet does
- Which formulas are included
- How to customize it
- How to troubleshoot common problems
Microsoft also provides Excel templates for common tasks such as budgeting, invoices and calendars.
Recommended resource: Excel Templates and Downloads
Excel Shortcuts and Productivity Tips
Keyboard shortcuts can significantly improve Excel productivity.
Some useful shortcuts include:
- Ctrl + C — Copy
- Ctrl + V — Paste
- Ctrl + X — Cut
- Ctrl + Z — Undo
- Ctrl + S — Save
- Ctrl + F — Find
- Ctrl + A — Select
- Ctrl + B — Bold
- Ctrl + 1 — Format Cells
- Alt + = — AutoSum
Instead of trying to memorize every shortcut, begin with the shortcuts you use frequently.
As your Excel skills improve, you can gradually add more advanced keyboard combinations.
Recommended resource: Excel Shortcuts and Productivity Tips
Excel for Business
Excel is widely used in business because it can adapt to many different workflows.
Sales Management
Sales teams can use Excel to track:
- Leads
- Customers
- Orders
- Revenue
- Sales targets
- Product performance
- Salesperson performance
Finance
Finance teams can use Excel for:
- Budgeting
- Expense tracking
- Revenue analysis
- Cash-flow analysis
- Profit calculations
- Financial reporting
Human Resources
HR teams can create:
- Employee databases
- Attendance sheets
- Leave trackers
- Salary calculations
- Recruitment trackers
Inventory
Inventory managers can track:
- Product quantities
- Purchases
- Sales
- Stock levels
- Reorder requirements
Project Management
Project teams can track:
- Tasks
- Deadlines
- Team members
- Status
- Budgets
- Progress
Excel for Data Analysis
Excel can be used for a complete data-analysis workflow.
A typical process is:
Collect → Clean → Organize → Calculate → Analyze → Visualize → Report
For example:
- Import sales data.
- Remove duplicates.
- Correct data types.
- Standardize values.
- Add calculations.
- Create PivotTables.
- Calculate KPIs.
- Create charts.
- Build a dashboard.
- Share the report.
For recurring or more complicated datasets, Power Query and Data Models can make the process more structured.
Excel and AI
Artificial intelligence is becoming increasingly relevant to spreadsheet workflows.
AI can assist with:
- Explaining formulas
- Generating formula suggestions
- Understanding spreadsheet errors
- Summarizing data
- Identifying trends
- Suggesting charts
- Creating analysis ideas
- Generating automation concepts
- Explaining Excel functions
For example, instead of asking:
“Give me an Excel formula.”
you can ask:
“I have sales data in columns A through F. I need to calculate total sales for customers from Delhi whose order value is above ₹10,000. Explain the formula step by step.”
This type of prompt gives AI enough context to provide a more useful answer.
AI should be treated as an assistant rather than a replacement for understanding spreadsheet logic. Always verify formulas and important business calculations.
Recommended resource: Excel AI and Automation Tutorials
Excel Automation
Automation is the process of reducing repetitive manual work.
Excel automation can involve:
- Formulas
- Power Query
- VBA
- Macros
- Office Scripts
- Power Automate
- AI tools
For example, a business reporting workflow could be:
New Data → Import → Clean → Calculate → Create Report → Notify Team
Power Query could handle data transformation.
Formulas could perform calculations.
PivotTables could summarize information.
Charts could visualize results.
Automation tools could then help distribute or trigger the next step.
This is where Excel becomes more than a simple spreadsheet and starts becoming part of a broader business workflow.
Excel and Power Automate
Microsoft’s automation ecosystem can connect spreadsheet-related workflows with other business processes.
For example, a workflow could involve:
Excel → Power Automate → Email
or:
Form Submission → Excel → Notification
This type of workflow can be useful for:
- Lead management
- Approval systems
- Notifications
- Reporting
- Data collection
- Administrative processes
The exact automation options depend on the Microsoft environment and services available to the user.
Common Excel Errors
Understanding Excel errors is an important part of becoming proficient with spreadsheets.
#DIV/0!
This generally appears when a formula tries to divide by zero or an empty value.
#N/A
This commonly indicates that a lookup or matching operation could not find the requested result.
#VALUE!
This can occur when a formula receives an inappropriate type of value.
#REF!
This indicates an invalid cell reference, often caused by deleting or moving referenced cells.
#NAME?
This can occur when Excel does not recognize a function name or another part of the formula.
Instead of simply hiding errors, try to understand why they occur. Proper error handling can make business spreadsheets more reliable.
Excel Date and Time Functions
Dates are extremely important in business spreadsheets.
Excel can be used to:
- Calculate age
- Calculate days between dates
- Find working days
- Calculate deadlines
- Extract month and year
- Create monthly reports
- Track invoices
- Track project deadlines
Useful functions include:
- TODAY
- NOW
- DATE
- YEAR
- MONTH
- DAY
- EDATE
- EOMONTH
- NETWORKDAYS
Date calculations become particularly useful for financial, HR, project-management and sales reports.
Excel Text Functions
Text functions help clean and manipulate information.
Useful functions include:
- LEFT
- RIGHT
- MID
- LEN
- TRIM
- UPPER
- LOWER
- PROPER
- CONCAT
- TEXTJOIN
- TEXT
For example, if customer names have inconsistent capitalization, text functions can help standardize them.
They are also useful when combining names, extracting codes and cleaning imported datasets.
Excel for Finance and Accounting
Excel is widely used for financial analysis and accounting-related work.
Common applications include:
- Expense tracking
- Budget planning
- Revenue reporting
- Profit and loss analysis
- Cash-flow tracking
- Loan calculations
- Investment calculations
- Financial projections
Financial spreadsheets should be carefully structured because errors in formulas can affect important business decisions.
Use clear labels, consistent formatting and appropriate checks whenever building financial workbooks.
Excel for Marketing
Marketing teams can use Excel to analyze:
- Leads
- Campaign performance
- Advertising costs
- Conversions
- Customer acquisition
- Website traffic
- Sales
- ROI
For example, a marketing report could contain:
Campaign | Spend | Leads | Customers | Revenue | ROI
This dataset can then be analyzed with formulas, PivotTables and dashboards.
Excel can therefore be useful for marketers who need flexible reporting without building a custom analytics application.
Excel for HR
Human resources teams often use spreadsheets for operational tracking.
Examples include:
- Employee information
- Attendance
- Leave
- Salary
- Recruitment
- Training
- Performance
- Department reporting
Data validation can help standardize status fields, while formulas can calculate totals and dates.
For larger HR systems, dedicated HR software may be more appropriate, but Excel remains useful for smaller datasets and analysis.
How to Become Advanced in Excel
Becoming advanced in Excel is not about memorizing every function.
A better approach is to learn progressively.
Beginner Level
Learn:
- Workbook basics
- Cells
- Rows
- Columns
- Formatting
- Basic formulas
- Sorting
- Filtering
Intermediate Level
Learn:
- IF
- SUMIFS
- COUNTIFS
- XLOOKUP
- Tables
- Conditional formatting
- Data validation
- Charts
Advanced Level
Learn:
- PivotTables
- PivotCharts
- Power Query
- Power Pivot
- Data Models
- Advanced formulas
- Dashboards
Automation Level
Learn:
- VBA
- Macros
- Office Scripts
- Power Automate
- AI-assisted workflows
This progression allows you to build practical skills without becoming overwhelmed.
Excel Best Practices
A well-designed spreadsheet should be easy to understand, maintain and update.
Use Clear Column Names
Use:
Date | Customer | Product | Revenue
instead of vague names such as:
Column 1 | Column 2 | Column 3
Keep Raw Data Separate
If possible, maintain a separate raw-data sheet and use other sheets for calculations and reporting.
Avoid Unnecessary Merged Cells
Merged cells can create problems with sorting, filtering and automation.
Use Consistent Formats
Dates, currency, percentages and numbers should use consistent formats.
Use Tables for Structured Data
Tables make datasets easier to manage and analyze.
Document Complicated Formulas
If another person will use the workbook, explain complicated calculations.
Keep Dashboards Simple
A dashboard should highlight important information rather than display every available metric.
Excel Learning Roadmap
If you want to learn Excel systematically, follow this roadmap.
Week 1: Excel Basics
Learn:
- Workbook structure
- Worksheets
- Cells
- Formatting
- Basic calculations
- Sorting
- Filtering
Week 2: Formulas
Learn:
- SUM
- AVERAGE
- COUNT
- IF
- SUMIF
- SUMIFS
- COUNTIF
- COUNTIFS
Week 3: Lookup and Data Functions
Learn:
- XLOOKUP
- VLOOKUP
- INDEX MATCH
- FILTER
- UNIQUE
- SORT
Week 4: Reporting
Learn:
- Tables
- Conditional formatting
- Charts
- PivotTables
- PivotCharts
- Slicers
Week 5: Advanced Data
Learn:
- Power Query
- Data cleaning
- Merge
- Append
- Data Models
Week 6: Automation
Learn:
- VBA
- Macros
- Office Scripts
- Power Automate
- AI-assisted Excel workflows
This gives you a practical learning path from beginner to advanced Excel user.
Excel Topic Cluster on ZeexasTech
The Excel section on ZeexasTech should work as a complete topic cluster.
The main pillar page is:
Excel
/excel/
From this page, users should be able to reach all major Excel topics.
Excel Basics
/excel/excel-basics/
Supporting topics:
- Excel for beginners
- Excel interface
- Worksheets
- Formatting
- Sorting
- Filtering
- Tables
Excel Formulas and Functions
/excel/formulas-functions/
Supporting topics:
- XLOOKUP
- VLOOKUP
- SUMIFS
- COUNTIFS
- IF
- FILTER
- UNIQUE
- INDEX MATCH
- Text functions
- Date functions
Excel Templates
/excel/templates/
Supporting topics:
- Invoice template
- Budget template
- Expense tracker
- Attendance template
- Inventory template
- Salary sheet
- Sales tracker
Excel Charts and Dashboards
/excel/charts-dashboards/
Supporting topics:
- Sales dashboard
- Finance dashboard
- HR dashboard
- KPI dashboard
- Interactive dashboard
- Excel charts
- Slicers
Excel PivotTables
/excel/pivottable/
Supporting topics:
- PivotTable basics
- PivotChart
- Slicers
- Grouping
- Calculated fields
- Sales PivotTable
Excel Power Query
/excel/power-query/
Supporting topics:
- Import data
- Clean data
- Merge
- Append
- Combine files
- Remove duplicates
- Data transformation
Excel Power Pivot
/excel/power-pivot/
Supporting topics:
- Data Models
- Relationships
- DAX
- Measures
- Calculated columns
- KPIs
Excel VBA and Macros
/excel/vba-macros/
Supporting topics:
- VBA basics
- Record macros
- VBA automation
- Loops
- Variables
- Automated reports
Excel AI and Automation
/excel/ai-automation/
Supporting topics:
- AI Excel formulas
- ChatGPT for Excel
- Excel AI prompts
- AI data analysis
- Excel automation
- Power Automate
- Office Scripts
Excel Internal Linking Strategy
The main /excel/ page should link to each major subtopic.
Each subtopic page should link back to /excel/.
Supporting articles should link to their relevant pillar.
For example:
XLOOKUP article
→ Excel Formulas and Functions
→ Excel main pillar
Power Query Merge article
→ Power Query pillar
→ Excel main pillar
Excel Dashboard article
→ Charts and Dashboards pillar
→ PivotTable article
→ Excel main pillar
This creates a logical relationship between the content.
Do not create dozens of unrelated links in every article. Links should be placed where they genuinely help readers continue learning.
Frequently Asked Questions About Excel
What is Excel used for?
Excel is used for calculations, data organization, budgeting, reporting, data analysis, charts, dashboards, inventory management, financial analysis and many other spreadsheet-related tasks.
Is Excel difficult to learn?
Excel is easy to start with but becomes more advanced as you learn formulas, PivotTables, Power Query, Data Models, VBA and automation. A structured learning path makes it easier to progress.
Which Excel formulas should beginners learn?
Beginners should start with SUM, AVERAGE, COUNT, IF, SUMIF and COUNTIF. After learning these basics, move to SUMIFS, COUNTIFS, XLOOKUP and other functions.
Is XLOOKUP better than VLOOKUP?
XLOOKUP provides more flexibility than VLOOKUP in supported Excel versions. However, VLOOKUP is still worth learning because many existing business workbooks use it.
What is a PivotTable?
A PivotTable is an Excel tool used to summarize and analyze structured data. It can calculate totals and other summaries by categories such as products, dates, employees and regions.
What is Power Query?
Power Query is a data-import and transformation technology used in Excel. It can help users clean, reshape, combine and refresh data.
What is Power Pivot?
Power Pivot is an advanced Excel data-analysis technology that works with Data Models, relationships and advanced calculations.
Can Excel be automated?
Yes. Excel can be automated using formulas, Power Query, VBA, macros, Office Scripts, Power Automate and other tools.
Can AI help with Excel?
AI can help users understand formulas, generate formula ideas, analyze information, troubleshoot problems and create automation ideas. Available capabilities depend on the Excel and Microsoft 365 environment.
Can Excel be used for business?
Yes. Excel is widely used for sales, finance, accounting, HR, inventory, marketing, project management and reporting.
How long does it take to learn Excel?
The time required depends on your starting level and goals. Basic Excel can be learned relatively quickly, while advanced skills such as Power Query, Power Pivot, VBA and automation require more practice.
Start Learning Excel with ZeexasTech
Excel is much more than a grid of cells.
It can be used to calculate information, organize business data, analyze performance, build reports, create dashboards and automate repetitive processes.
The best way to learn Excel is through practical projects.
Start with the basics. Learn formulas. Practice with real datasets. Build tables and reports. Then move into PivotTables, dashboards and Power Query. Once you are comfortable with advanced data analysis, explore Power Pivot, VBA, automation and AI-assisted workflows.
Whether you are a student learning Excel for the first time, a professional trying to improve productivity, a business owner building reports or an analyst working with complex datasets, the Excel resources on ZeexasTech can help you develop your skills step by step.
Start your Excel learning journey with ZeexasTech and explore the complete collection of Excel tutorials, formulas, templates, dashboards, data-analysis guides and automation resources.